



The IAMMETER solar PV overview dashboard helps users understand how electricity flows in a home solar system.
It shows more than solar generation. It also helps answer practical questions:
If you are looking for the complete application overview, start here:
If you are setting up the system for the first time, see:
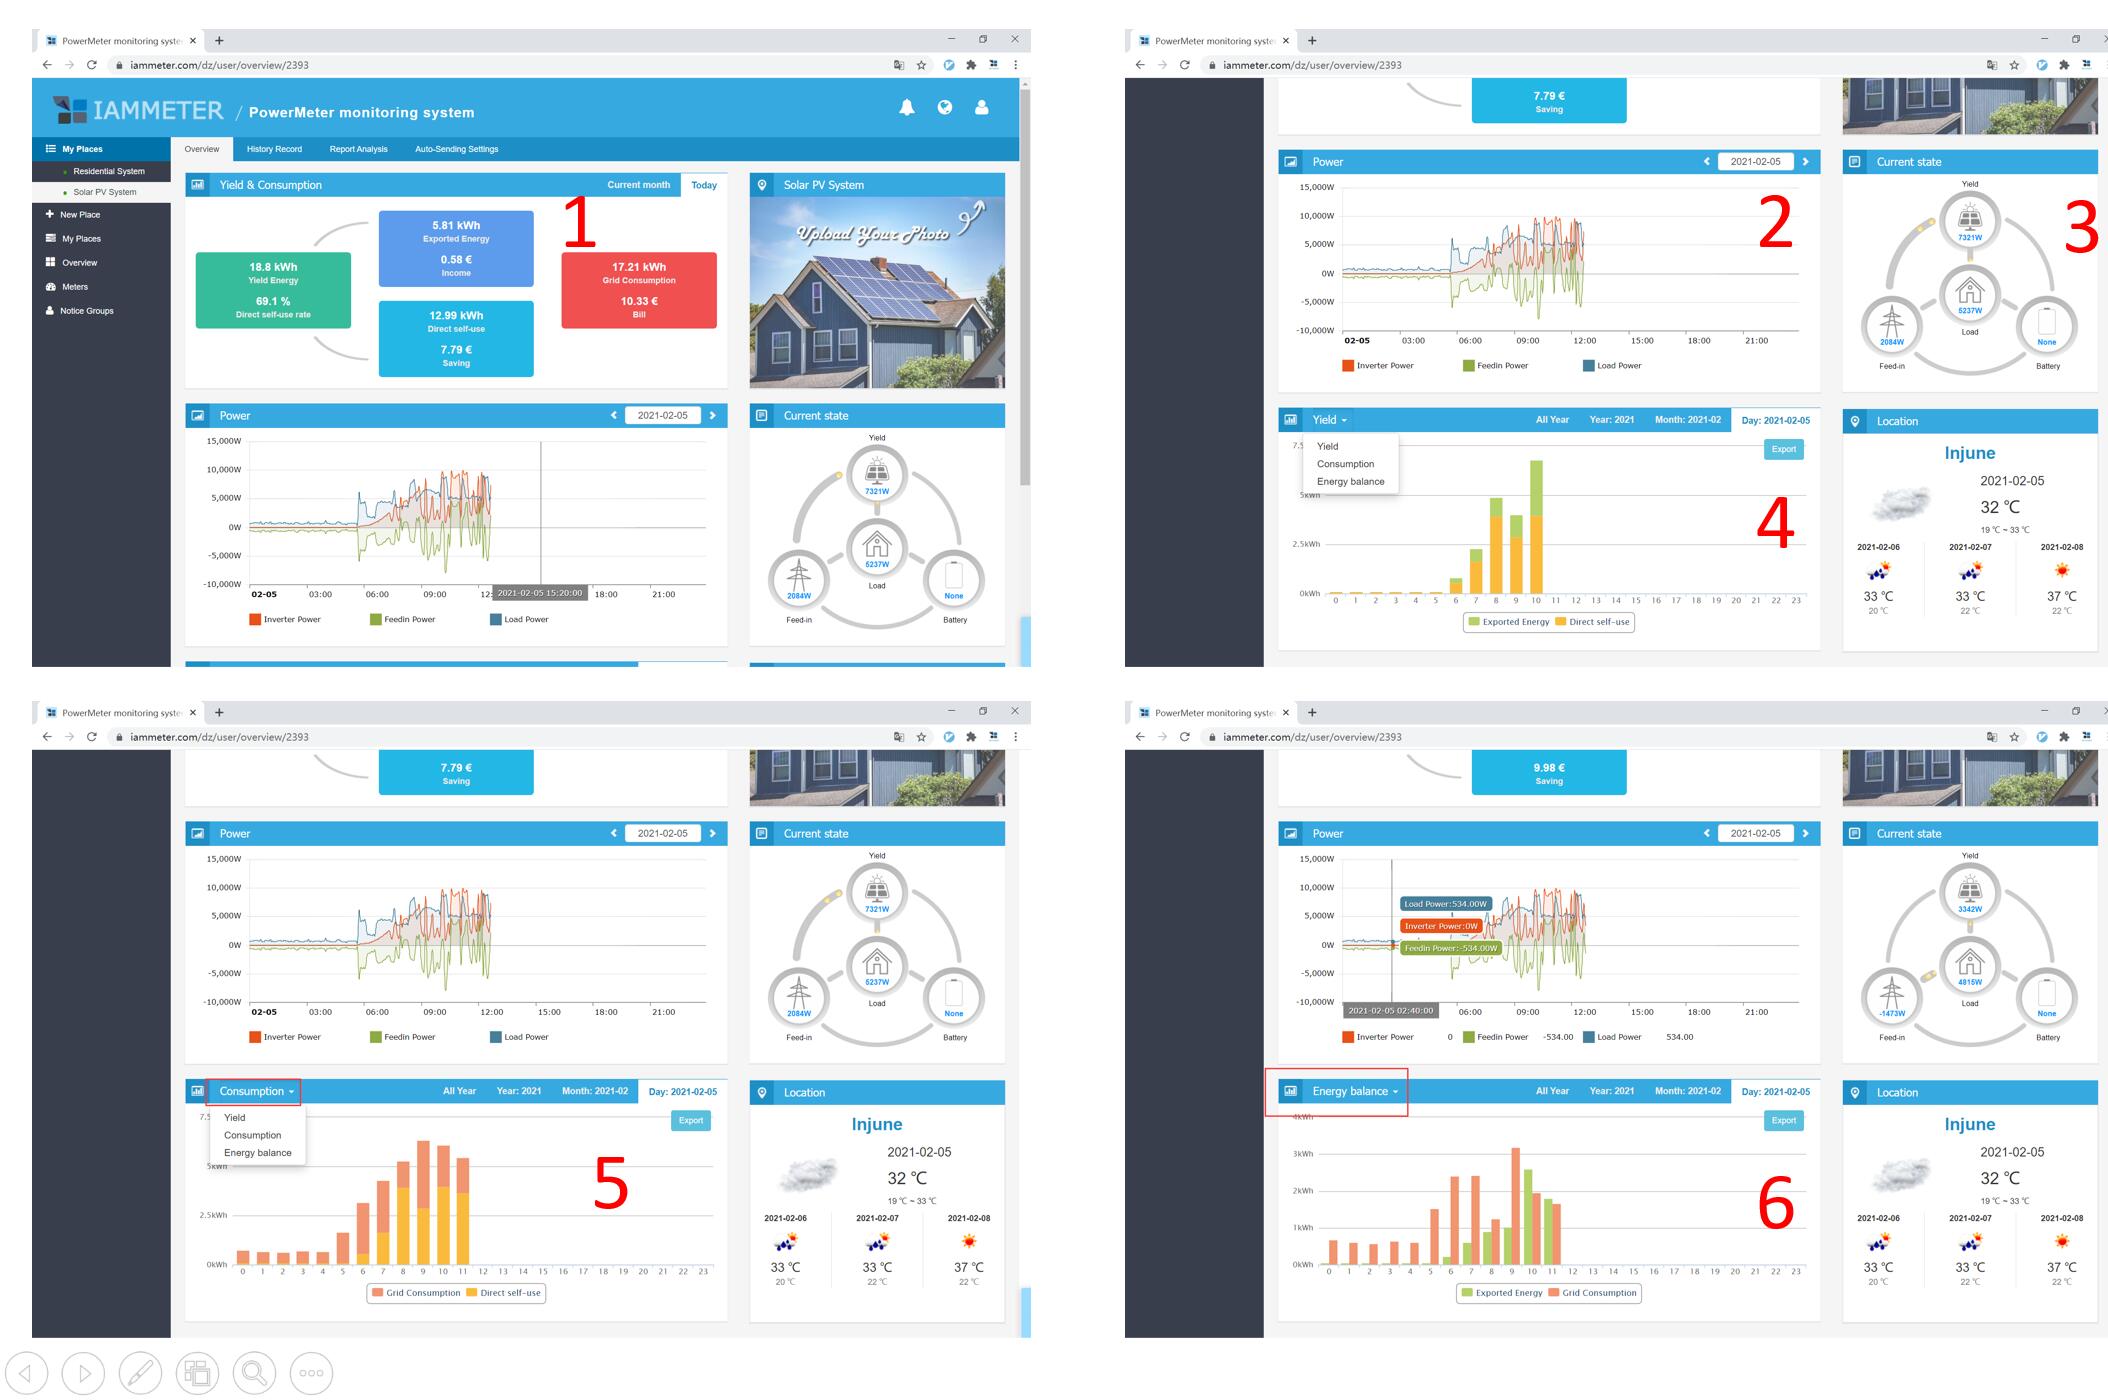
The overview page summarizes the most important solar PV metrics in one place.
| Metric | Meaning |
|---|---|
| Yield Energy | Solar energy generated by the inverter |
| Exported Energy | Surplus solar energy exported to the grid |
| Grid Consumption | Electricity imported from the grid |
| Direct Self-use | Solar energy used directly inside the home |
| Self-consumption Rate | Percentage of solar energy used on site |
| Income | Estimated feed-in income from exported solar energy |
| Saving | Estimated value of solar energy used directly |
| Bill | Estimated grid electricity cost |
Important formulas:
Direct self-use = Yield Energy - Exported Energy
Self-consumption rate = Direct self-use / Yield Energy
Saving = Imported power tariff x Direct self-use
Income = Exported power tariff x Exported Energy
Bill = Imported power tariff x Grid Consumption
These values help users understand whether the solar PV system is mainly powering the home or exporting most energy to the grid.
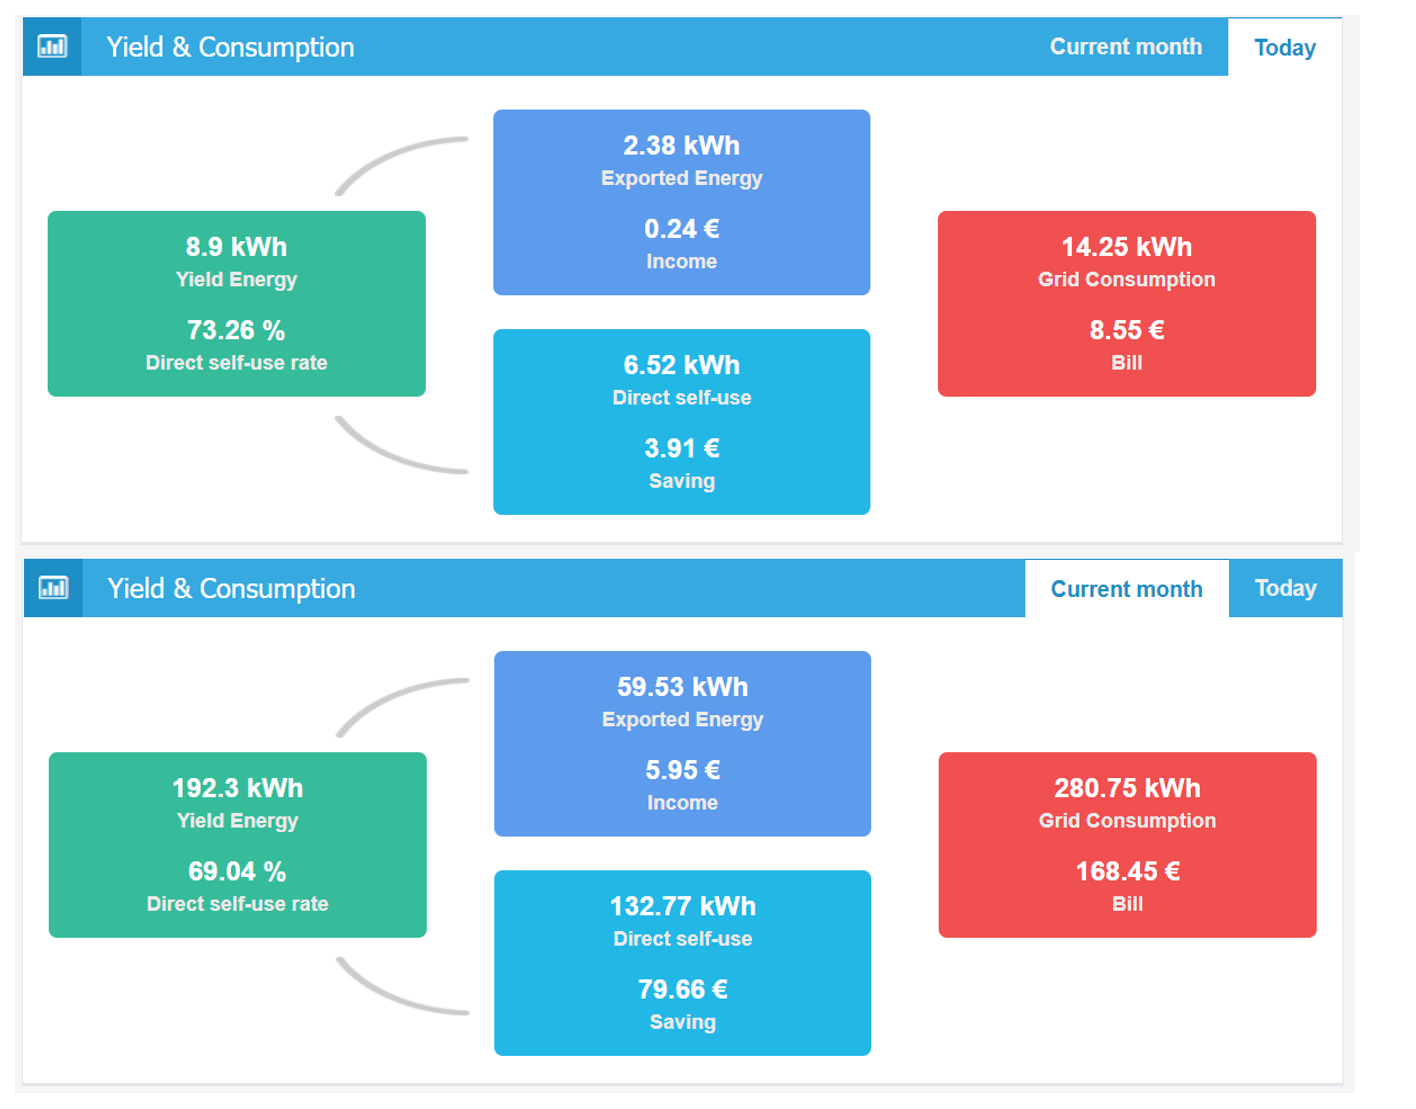
The power section shows what is happening right now.
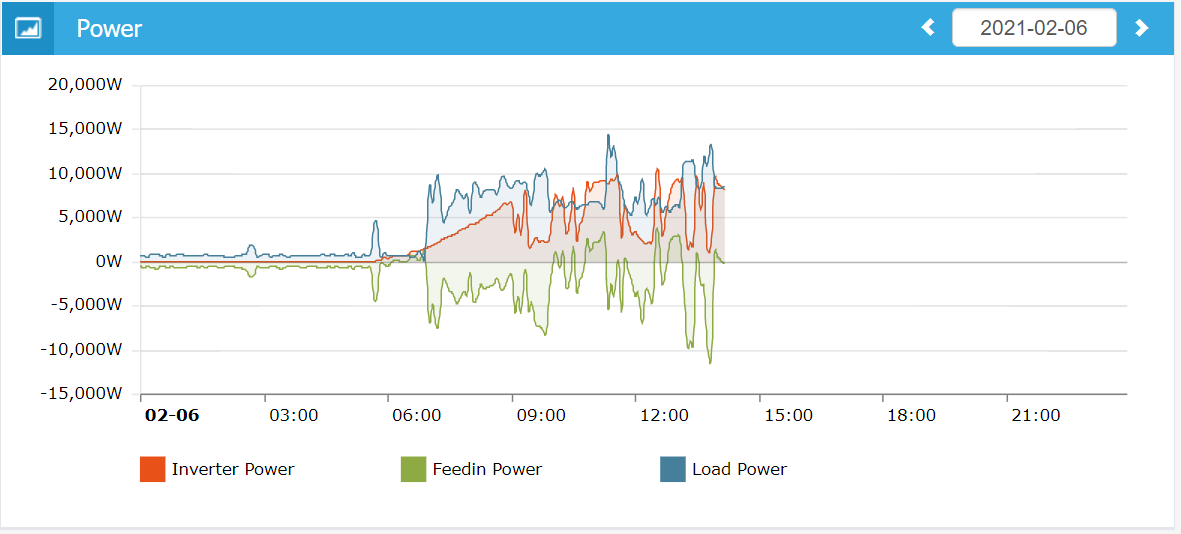
| Power value | Meaning |
|---|---|
| Inverter Power | Real-time output power of the solar inverter |
| Feed-in Power | Real-time grid-side power |
| Load Power | Estimated household load power |
In IAMMETER:
The exact result depends on correct wiring and correct meter/CT Use Type settings.
The energy flow chart visualizes the current operating state of the solar PV system.
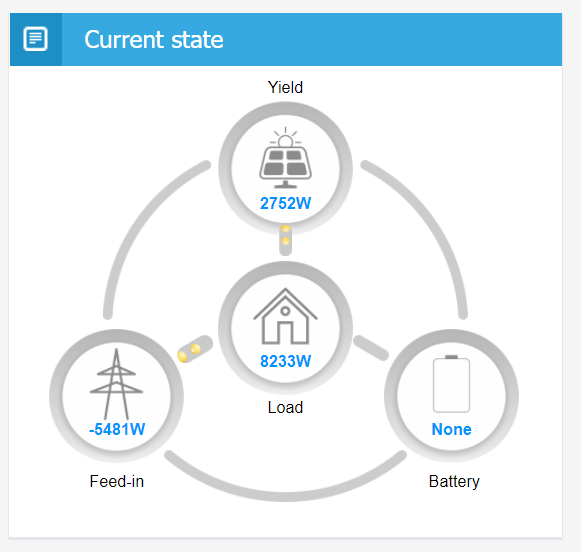
Typical states include:
This view is useful for quickly checking whether your home is using solar energy directly or still depending on grid electricity.
The Yield chart shows solar energy generation over a selected time period.
IAMMETER can display yield data by:
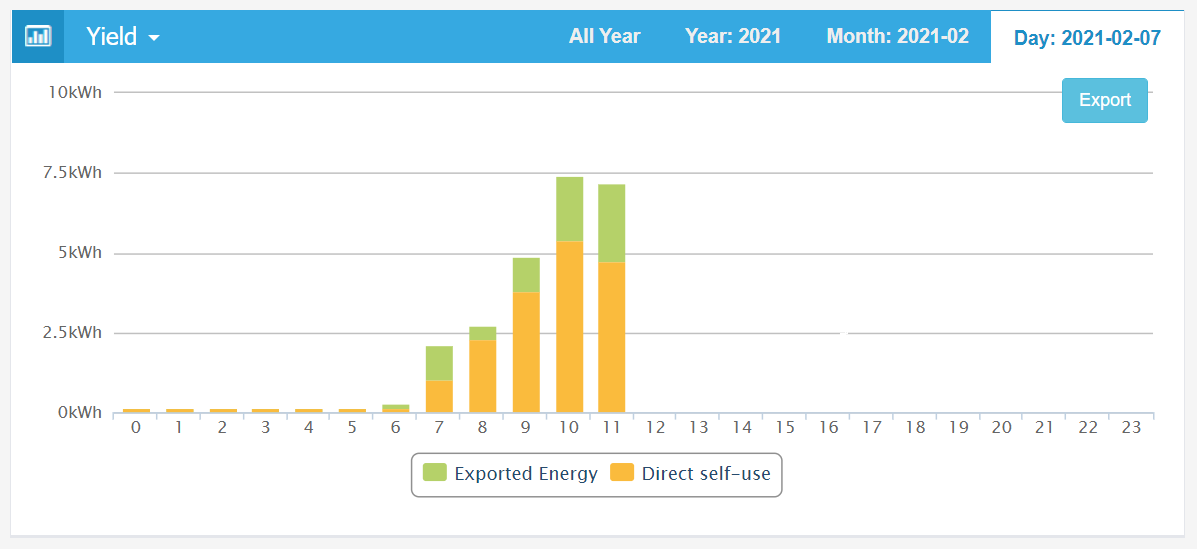
The key relationship is:
Solar yield energy = Direct self-use energy + Exported energy
If exported energy is high, it means a large part of solar generation is not used directly inside the home.
The Consumption chart shows how household electricity use is supplied.
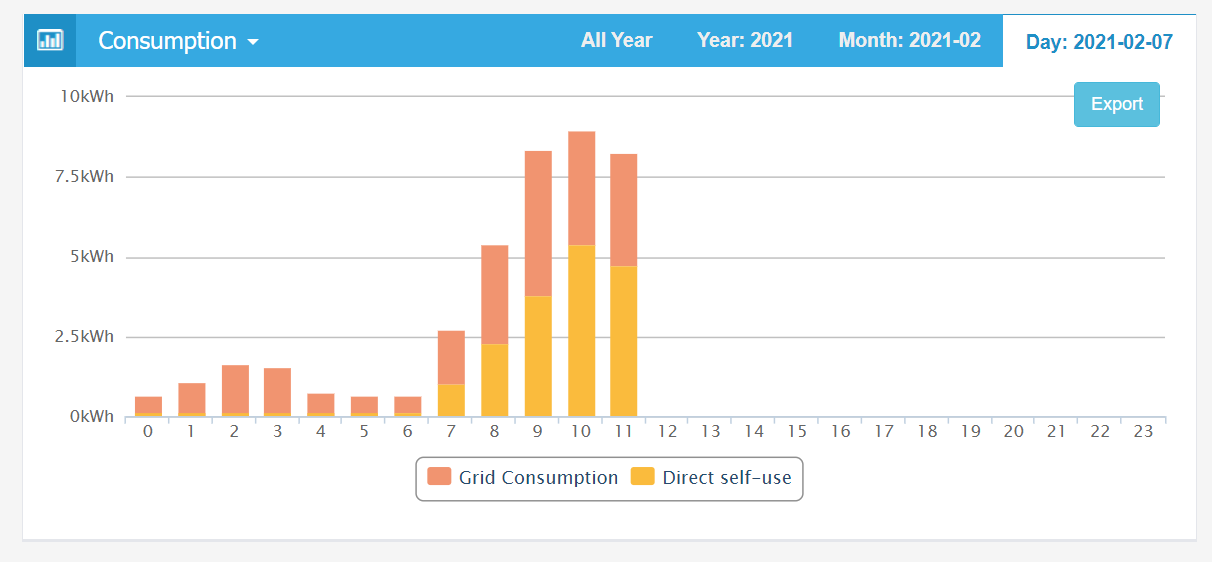
The key relationship is:
Home consumption = Direct self-use energy + Grid import energy
This helps users understand:
The Energy Balance chart compares electricity imported from the grid and exported to the grid.
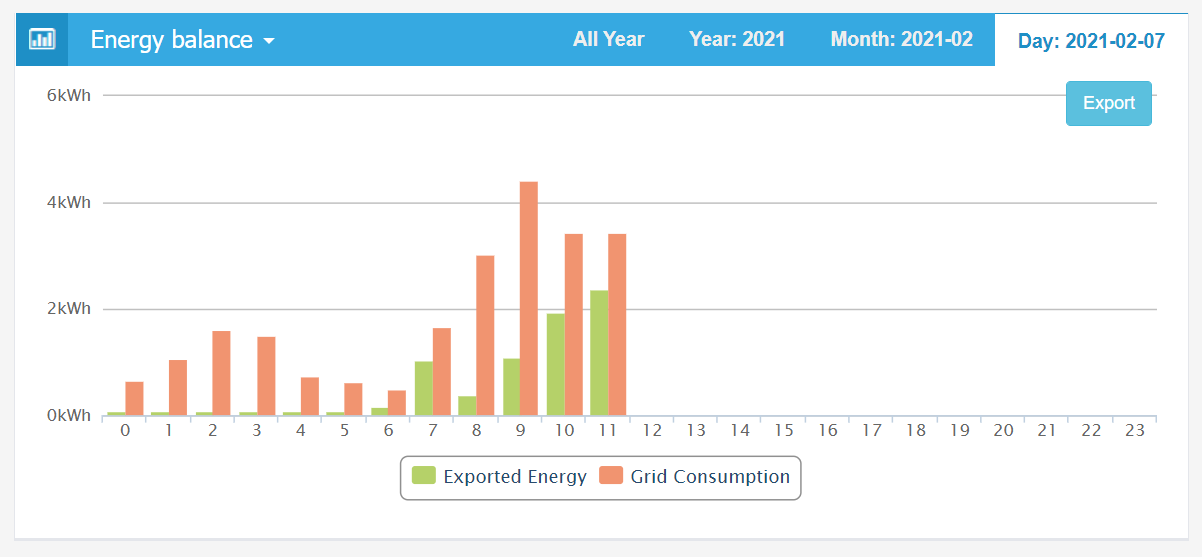
This chart is especially useful for users who care about:
If export is high while grid import is also high at other times, there may be an opportunity to shift controllable loads to daytime solar production.
The solar overview dashboard can show whether your system has surplus solar energy.
If Exported Energy is high, you may be able to improve self-consumption by using more energy during solar production hours.
Examples:
For resistive loads such as electric boilers or water heaters, IAMMETER can work with the WPC3700 Wi-Fi Power Controller to use solar surplus more effectively.
Learn more:
The solar overview page depends on correct meter setup.
To get accurate production, consumption, import/export, and self-consumption data:
Grid.Inverter if you want to monitor solar production.For setup details:
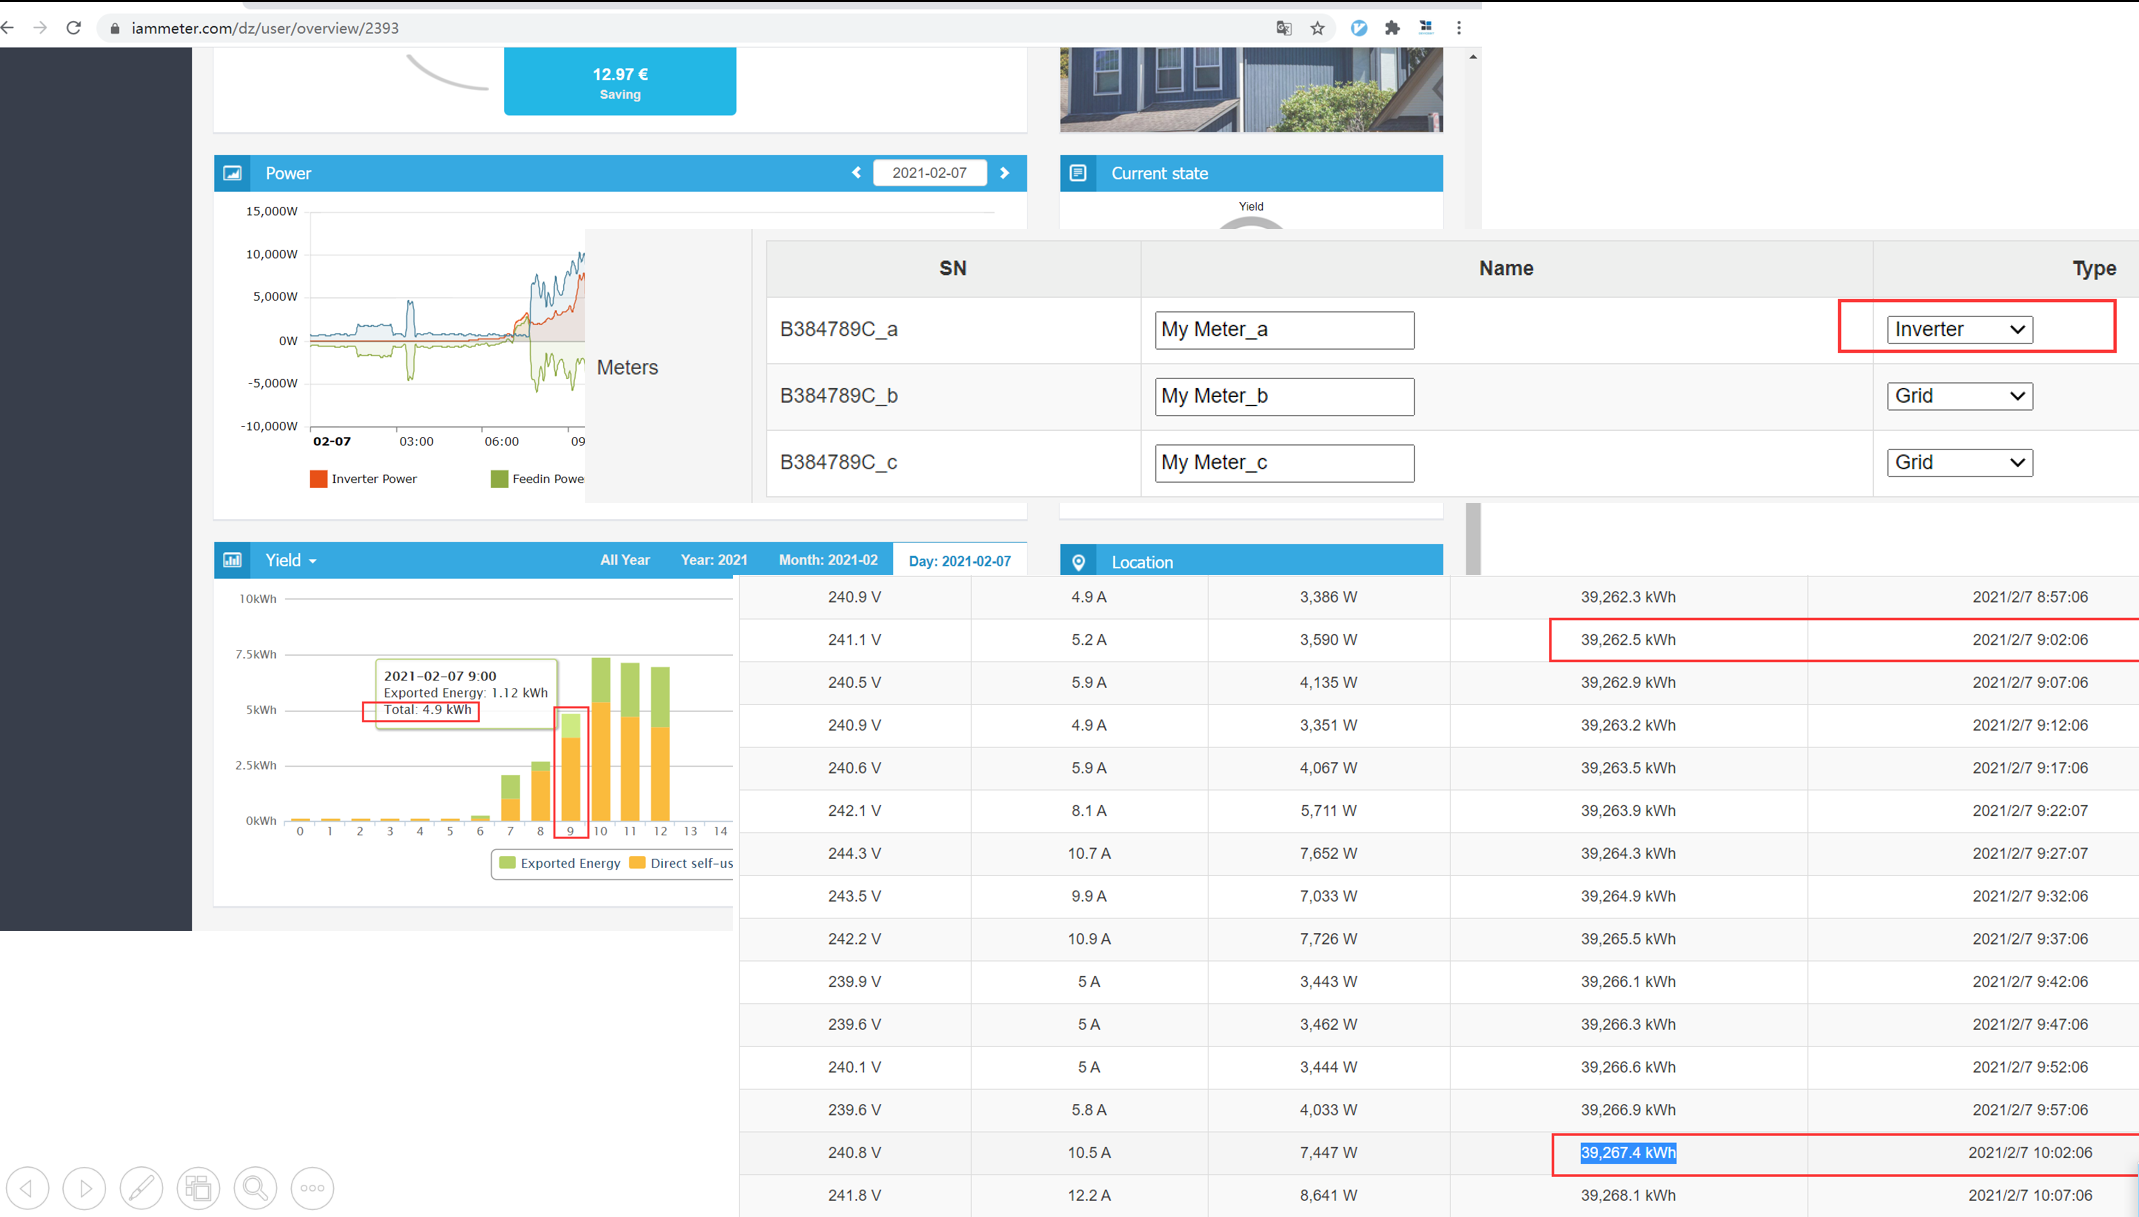
IAMMETER calculates energy values by comparing meter readings over time.
For example:
Energy in current period = first kWh reading in next period - first kWh reading in current period
The same calculation applies to hourly, daily, monthly, and yearly reports.
This is why stable meter communication and correct meter configuration are important for accurate reports.
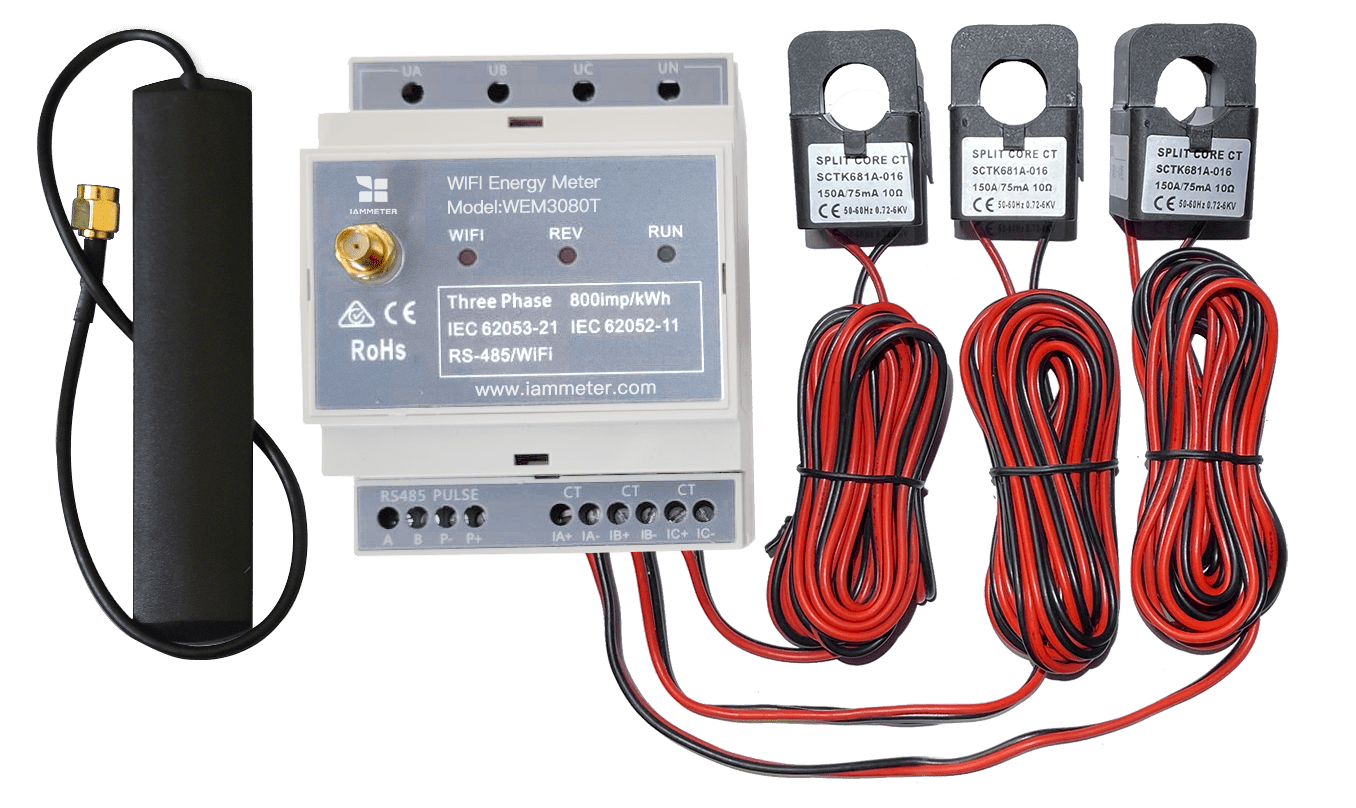
Three Phase Wi-Fi Energy Meter (WEM3080T)
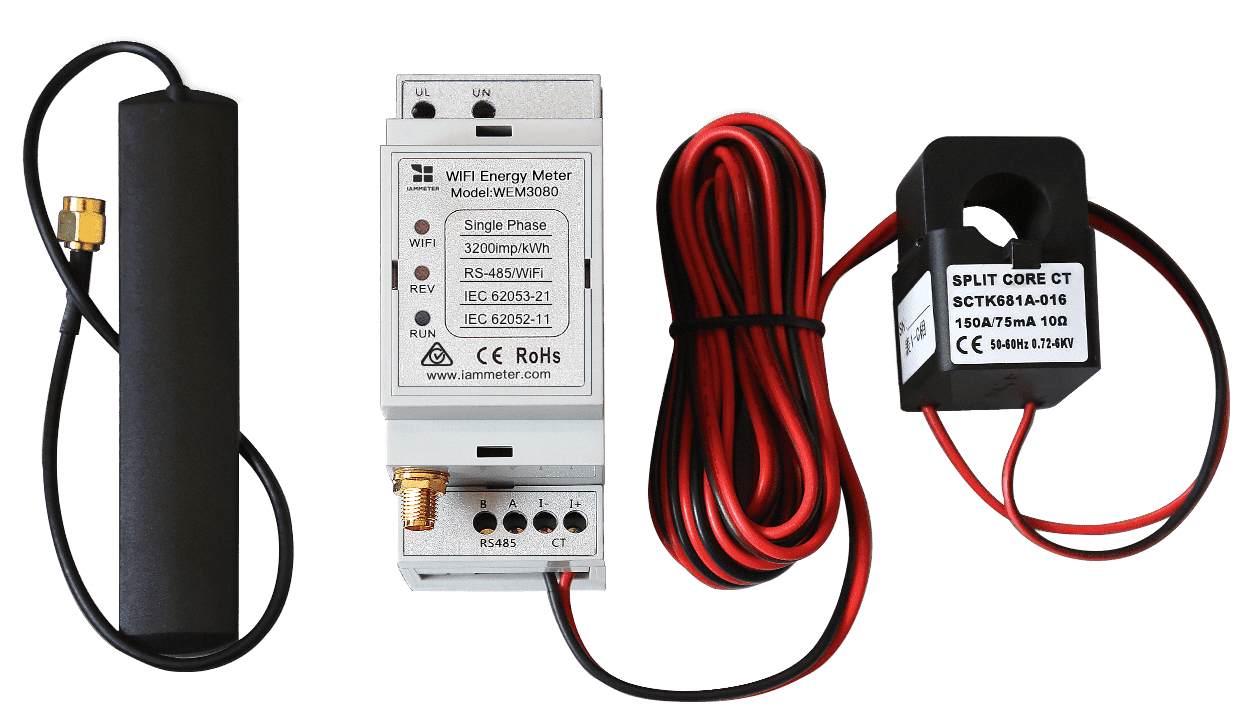
Single Phase Wi-Fi Energy Meter (WEM3080)
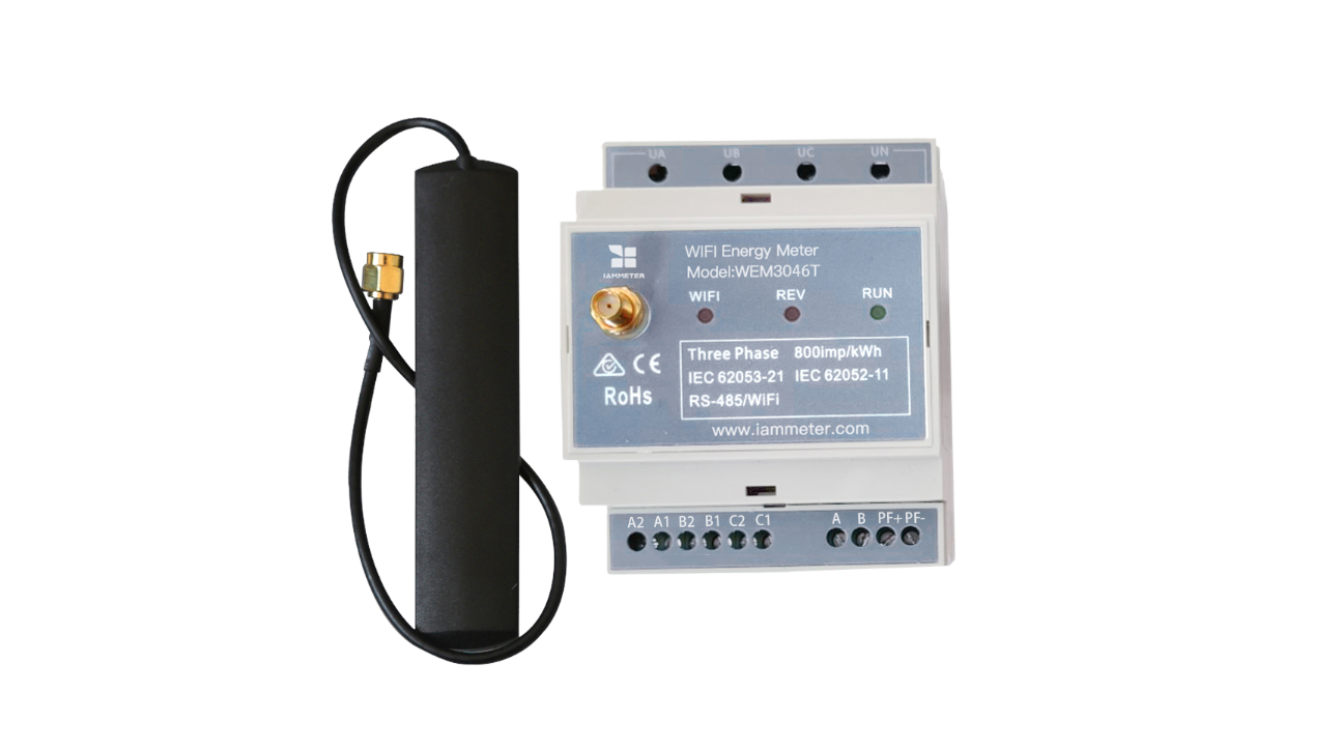
Three Phase Wi-Fi Energy Meter (WEM3046T)
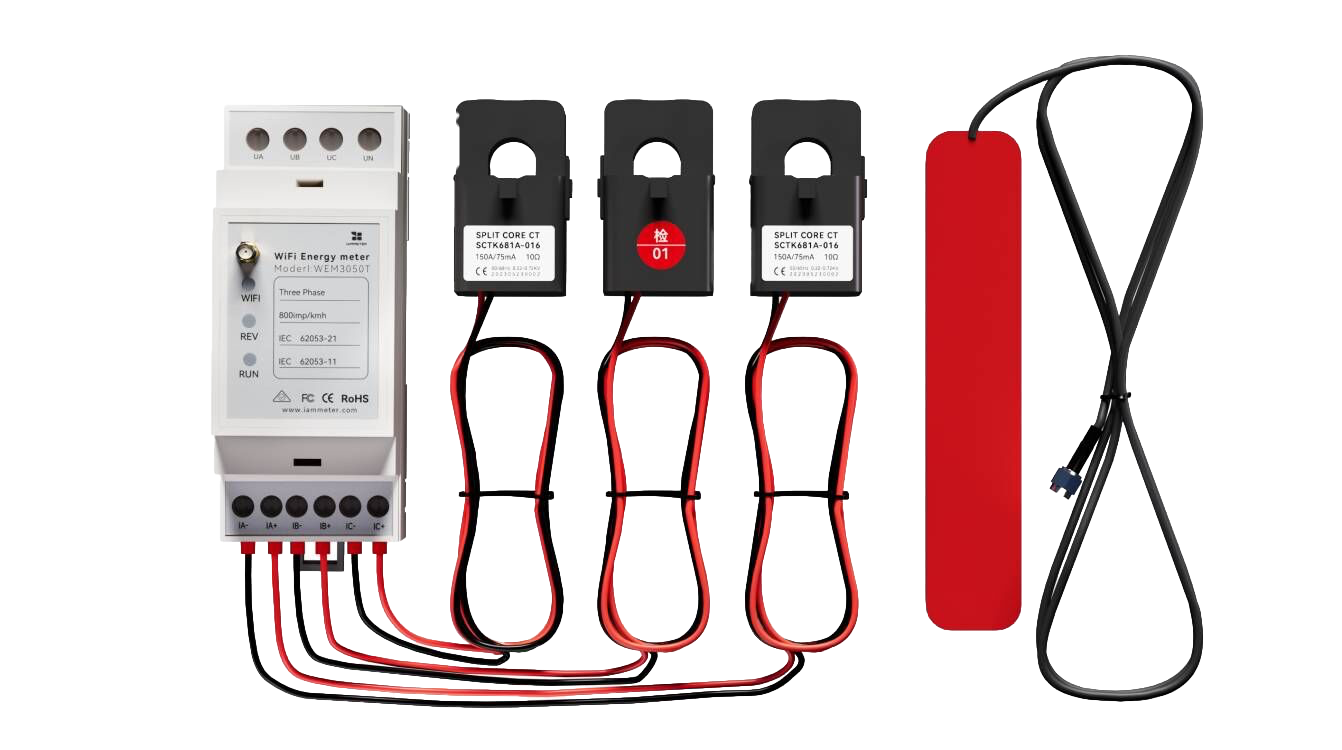
Three Phase Wi-Fi Energy Meter (WEM3050T)