



IAMMETER solar PV reports help users understand the financial and energy performance of a home solar system.
The reports answer practical questions:
If you want the complete solar monitoring workflow, start here:
For real-time dashboard metrics, see:
IAMMETER-Cloud reports connect energy data with electricity cost.
| Question | Report value |
|---|---|
| How much electricity did the home buy from the grid? | Grid Consumption |
| How much solar energy was exported? | Exported Energy |
| How much did imported electricity cost? | Electricity Bill |
| How much feed-in income was generated? | Income |
| How much solar energy was used directly? | Direct Self-use |
| How much money did solar save? | Total Saving |
| What is the self-consumption rate? | Direct Self-use Rate |
These reports are especially useful when grid electricity prices and feed-in tariffs are different. In many regions, using solar energy directly is worth more than exporting it to the grid.
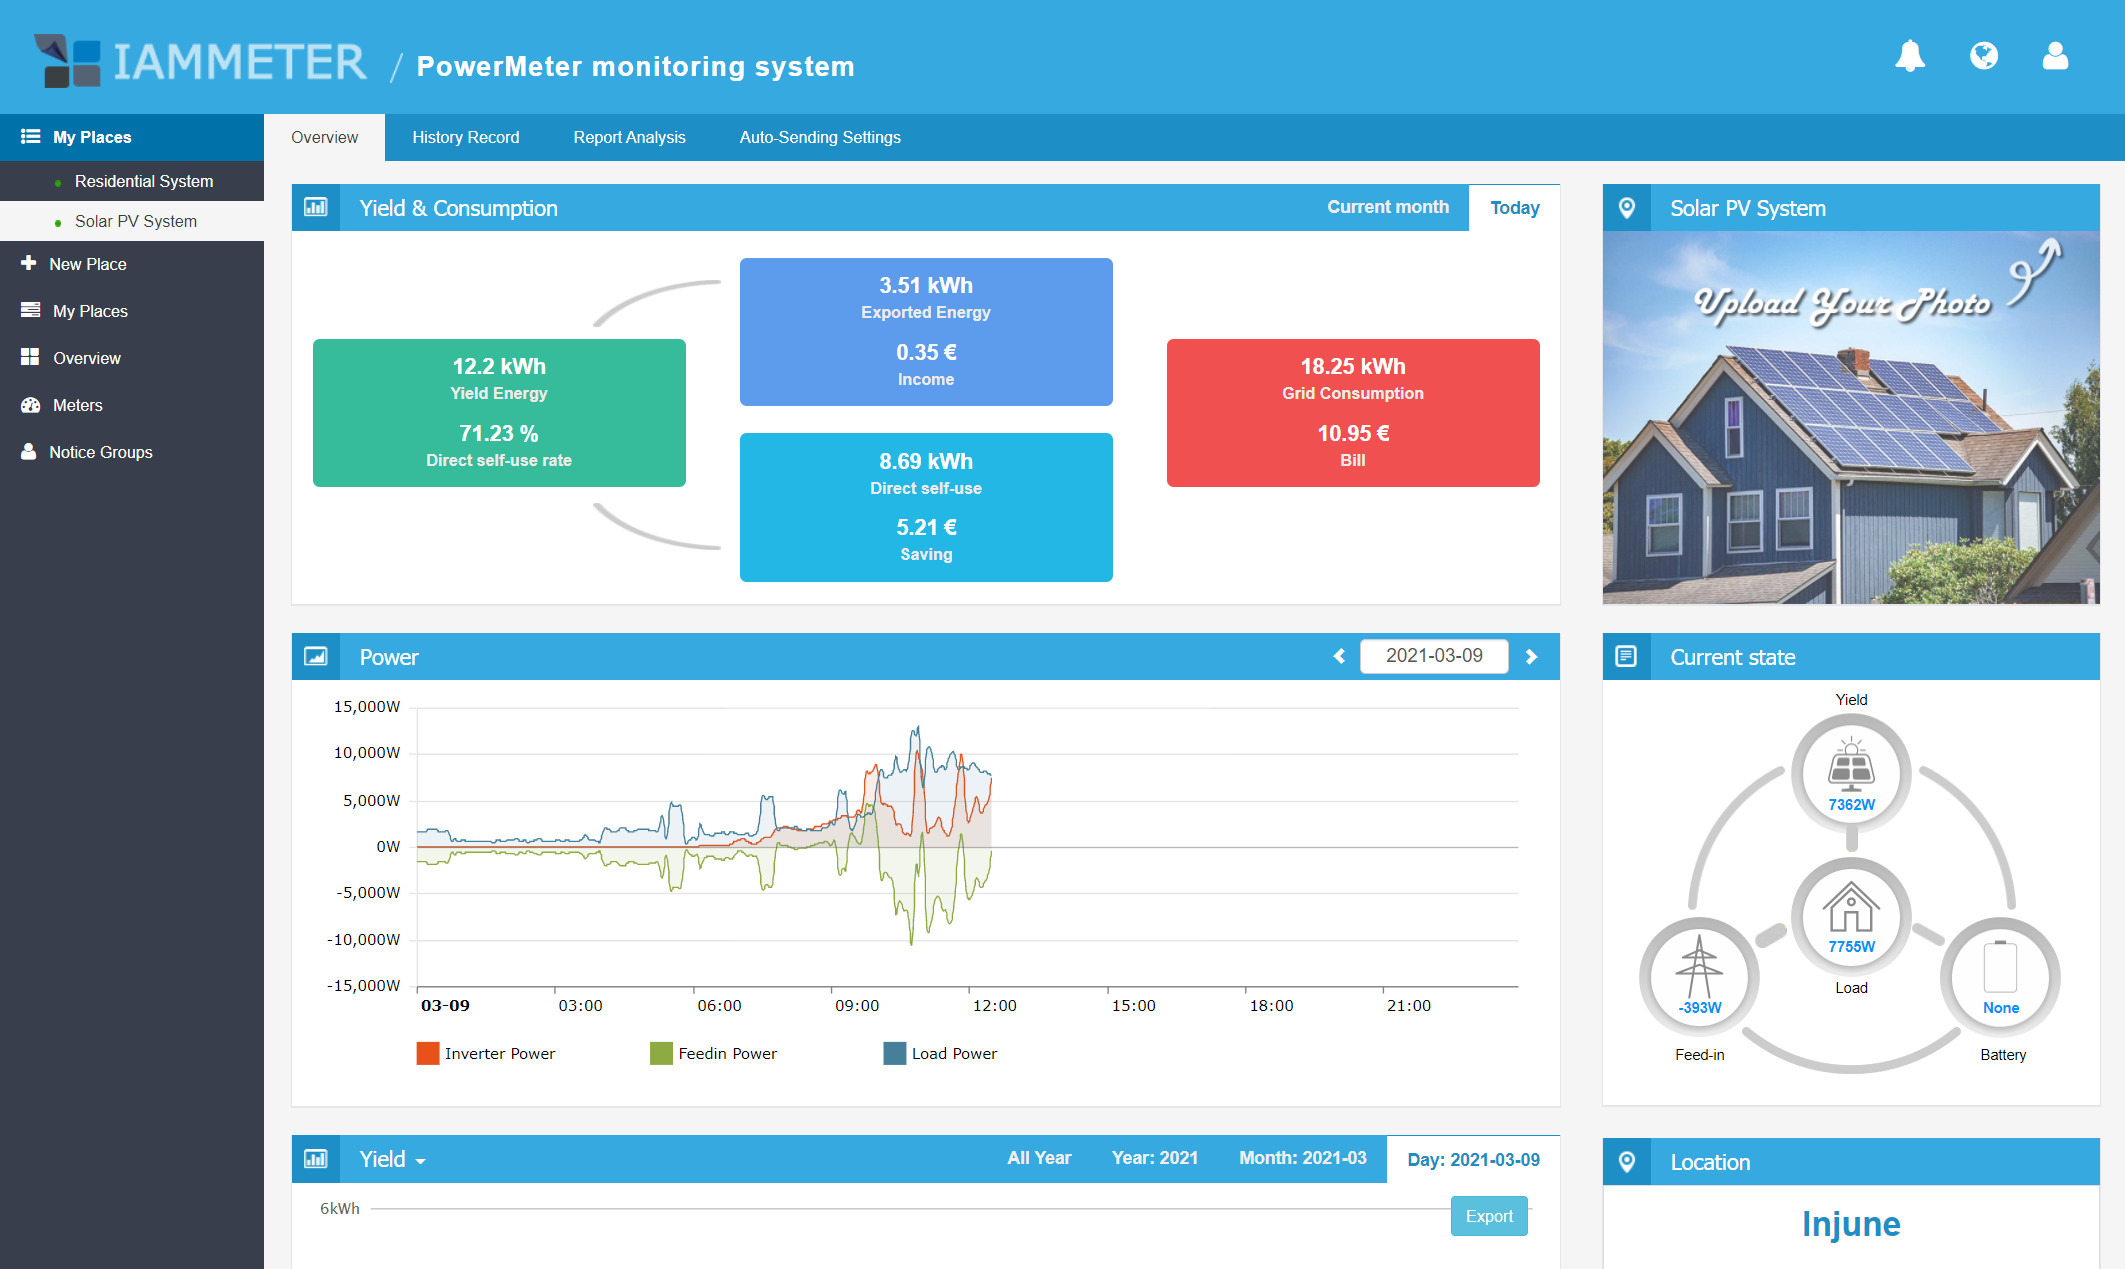
The solar overview page shows KPIs and real-time energy flow for the solar PV system.
It is useful for checking current status, while the reports are better for analyzing daily, monthly, and yearly performance.
Learn more:
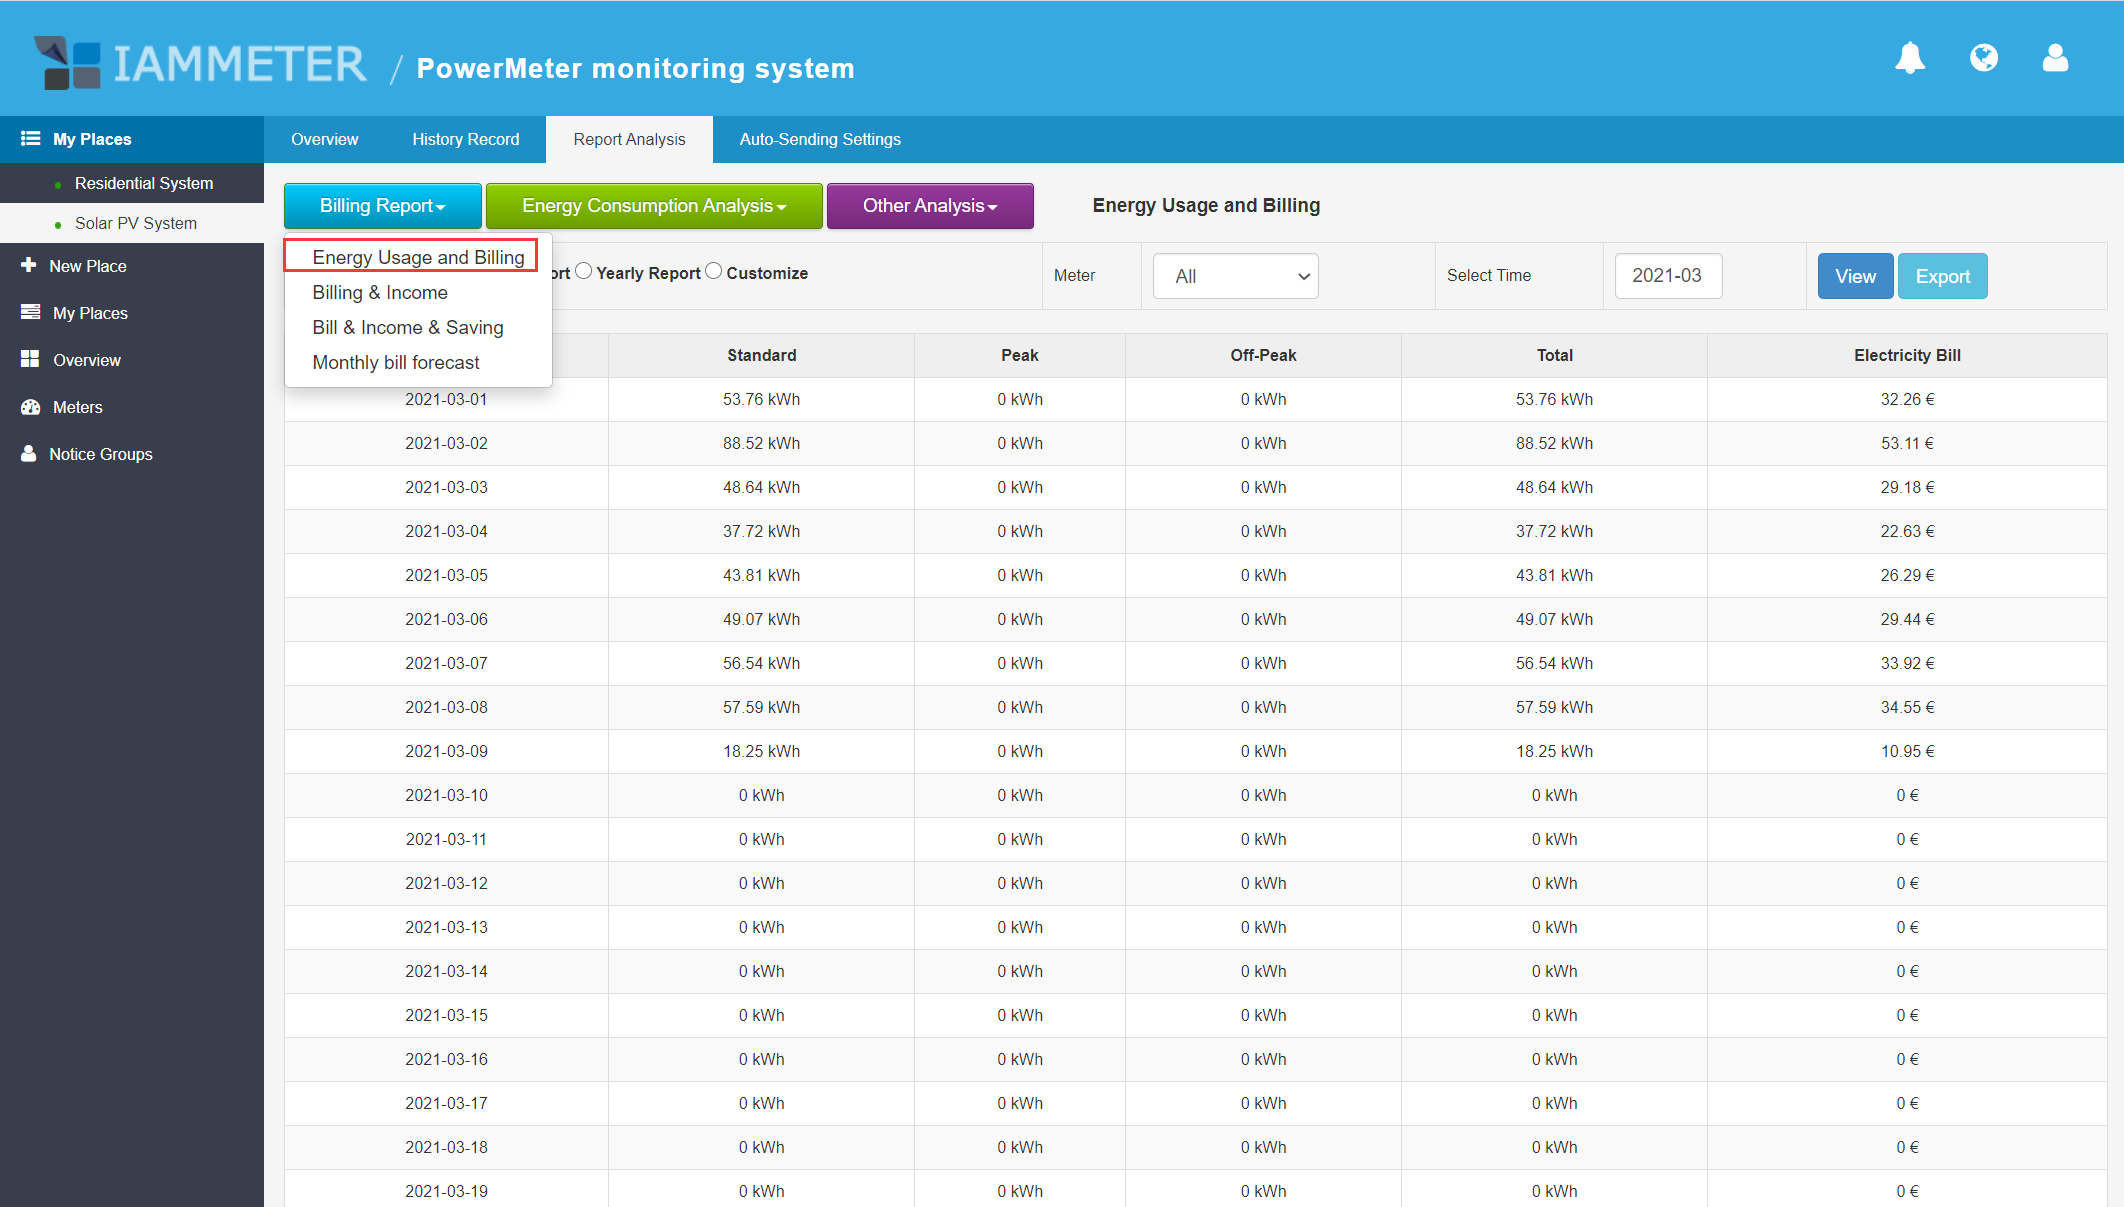
The Energy Usage and Billing report shows grid consumption and electricity bill over selected time periods.
It helps users understand:
If your electricity price changes by time period, configure the correct tariff plan:
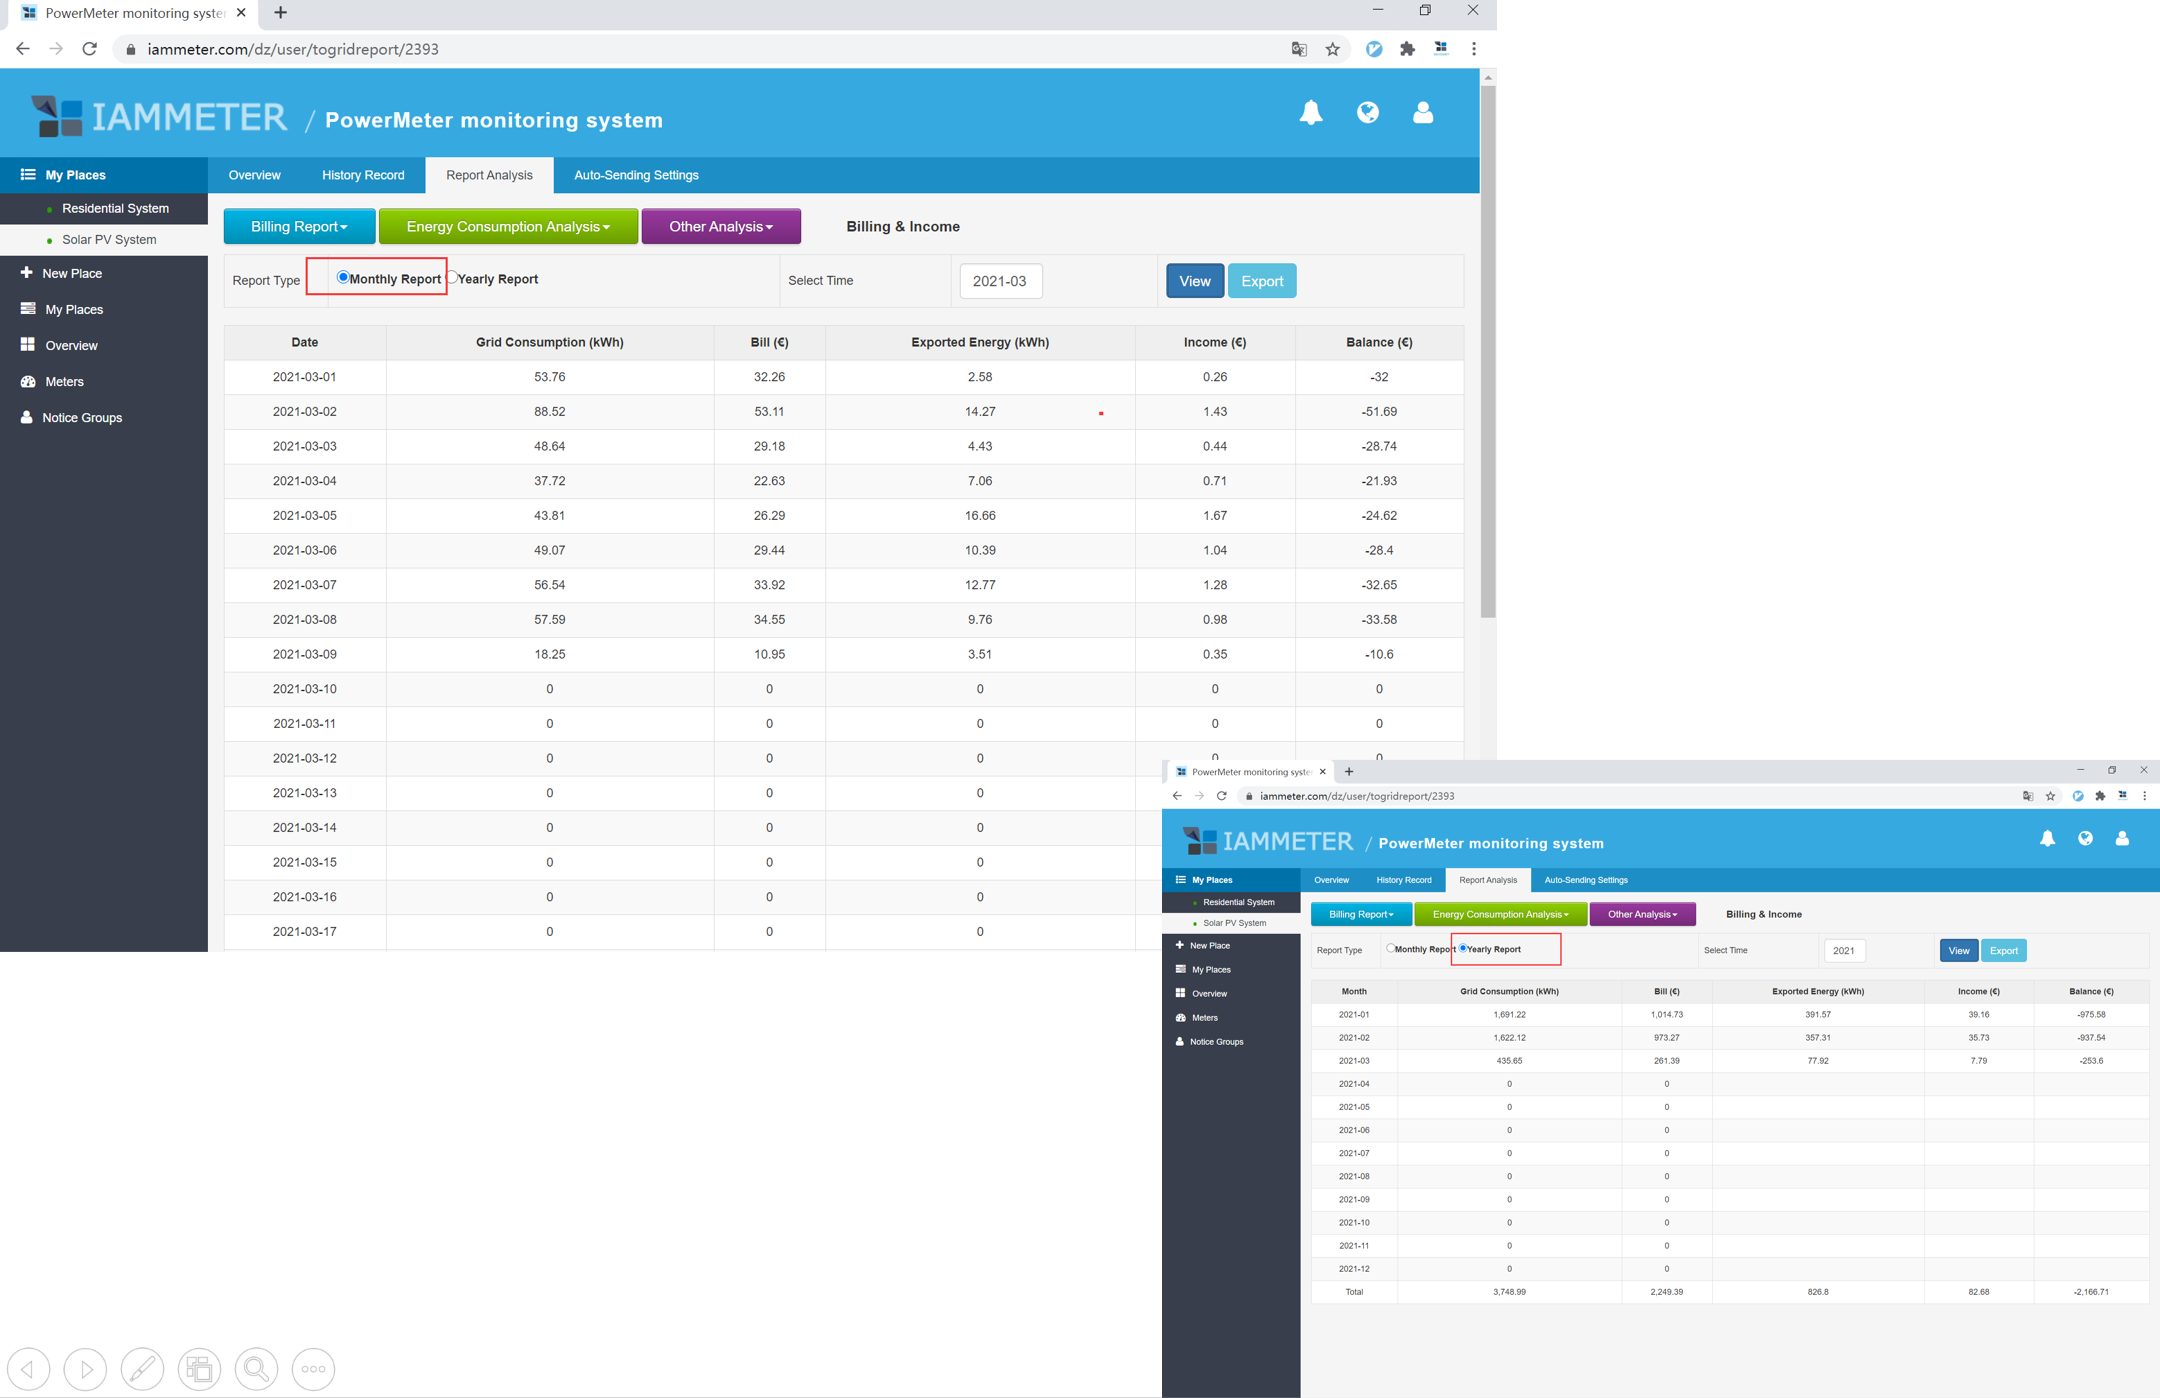
The Billing and Income report compares:
This report is useful for users who want to understand both sides of the solar economics:
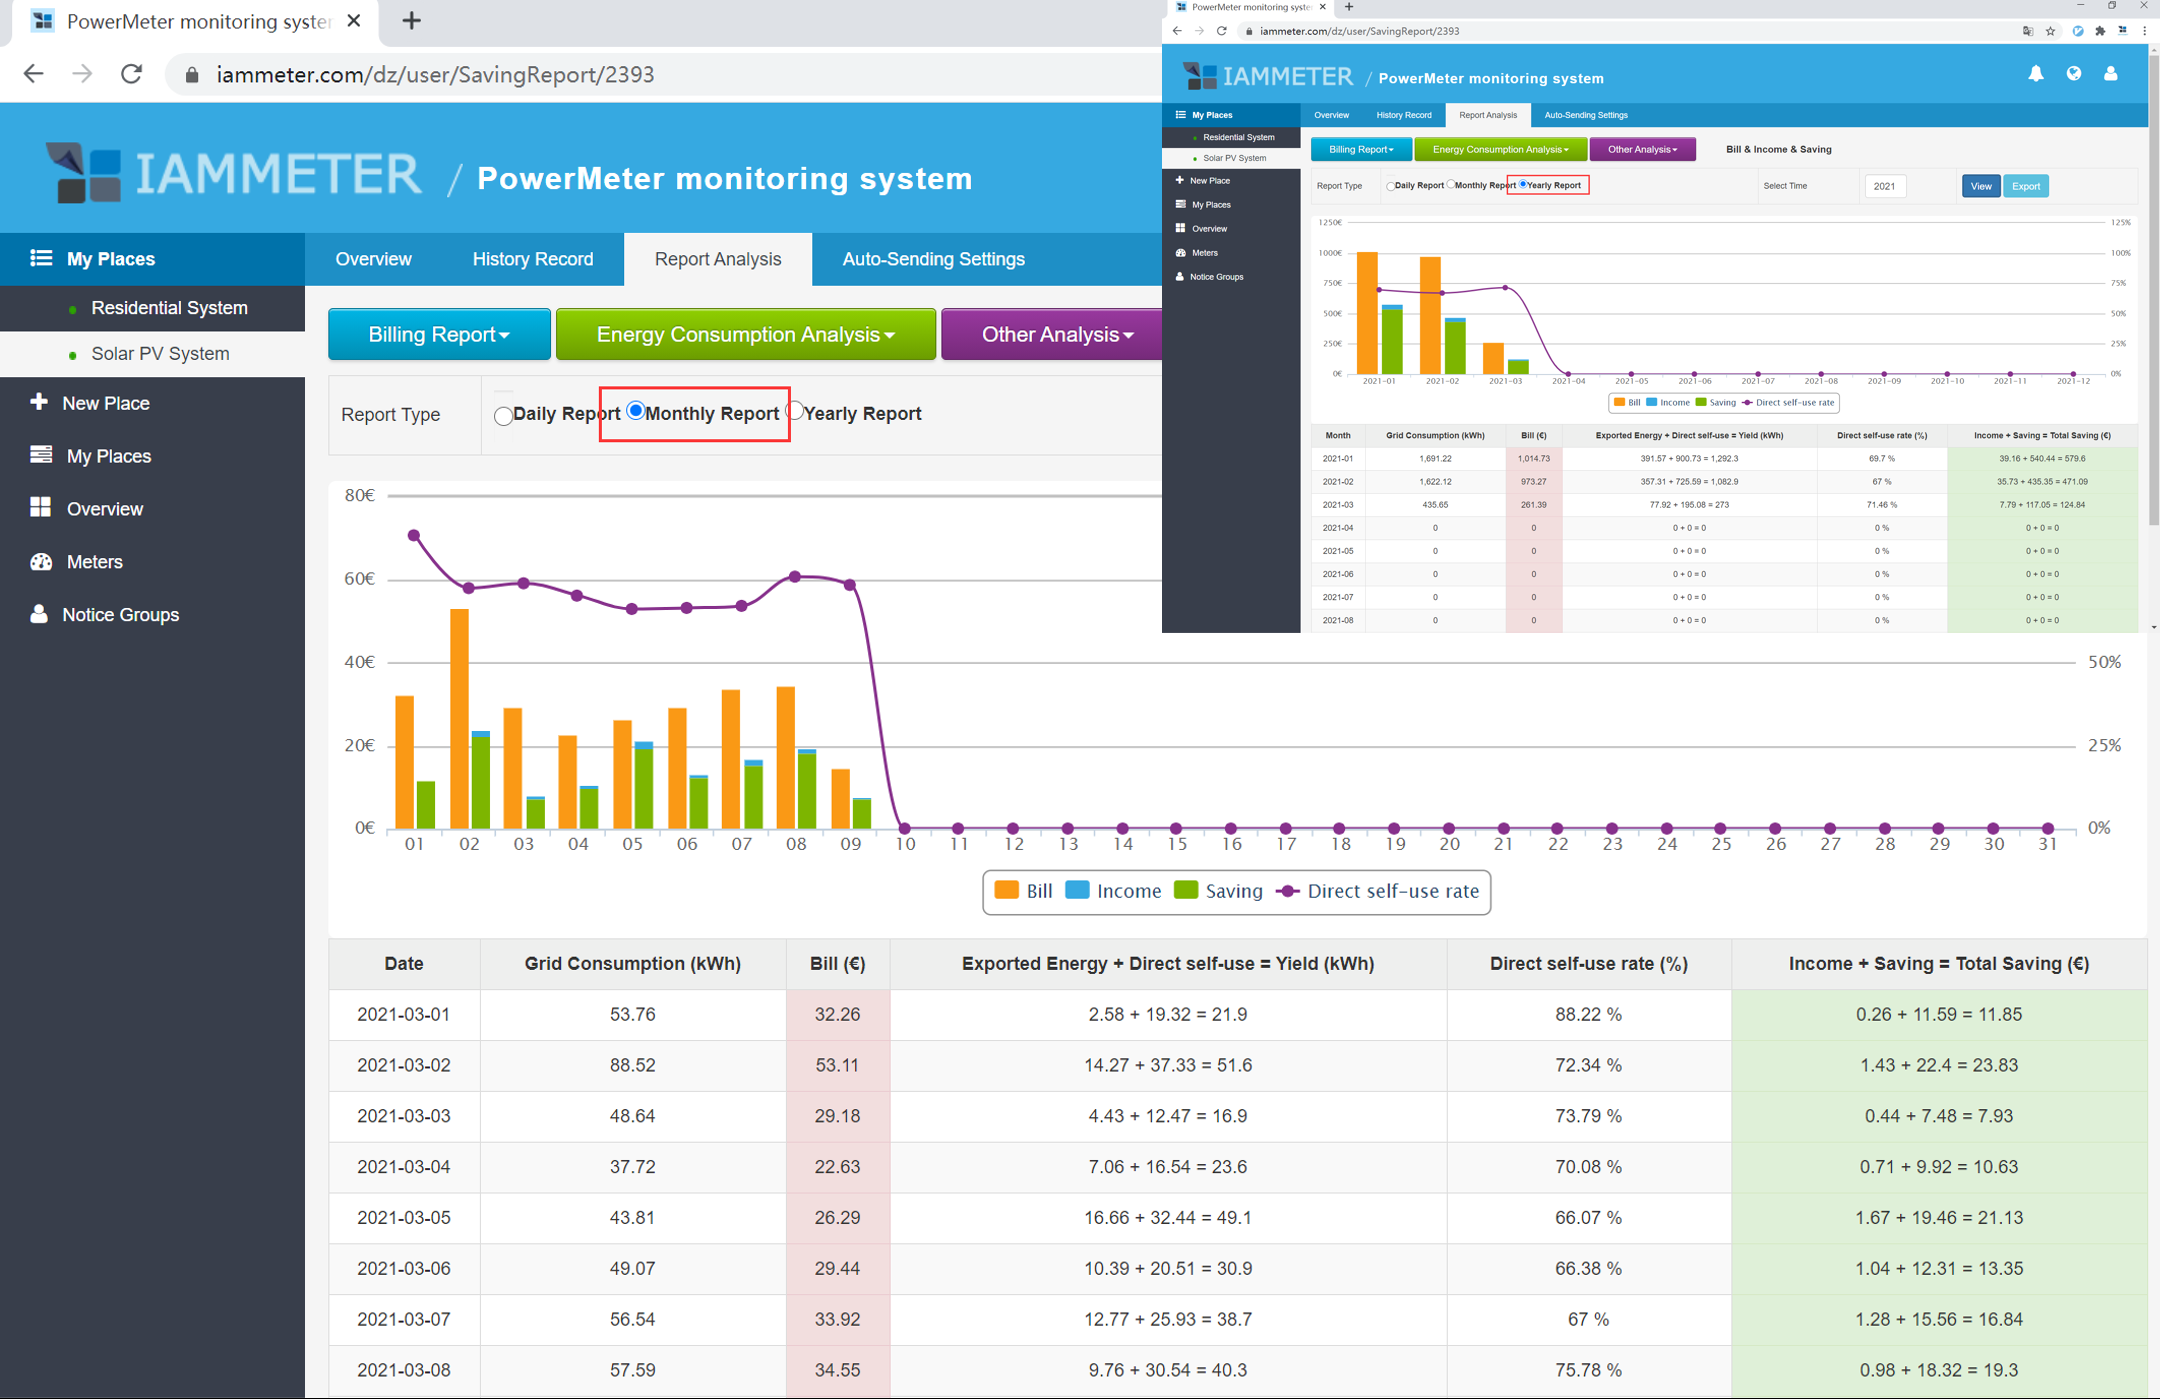
The Bill, Income and Saving report focuses on the real value of the solar PV system.
It shows:
In many countries and regions, the feed-in tariff is much lower than the grid electricity price. This means the direct self-use of solar energy is often more valuable than exporting solar energy to the grid.
For example, if the grid electricity price is 0.25/kWh and the feed-in tariff is 0.05/kWh, using 1 kWh of solar energy inside the home avoids 0.25 of grid cost, while exporting it only earns 0.05.
That is why Direct Self-use Rate is an important KPI for home solar users.
IAMMETER calculates solar benefit based on direct self-use and exported energy.
Basic formula:
Total benefit = direct self-use energy x grid electricity price + exported energy x feed-in tariff
Where:
This helps users evaluate whether the solar PV system is reducing electricity costs as expected.
Reports can show whether there is unused solar potential.
If Exported Energy is high:
Optimization options include:
For resistive loads such as electric boilers, IAMMETER can use the WPC3700 Wi-Fi Power Controller to increase solar self-consumption.
Learn more:
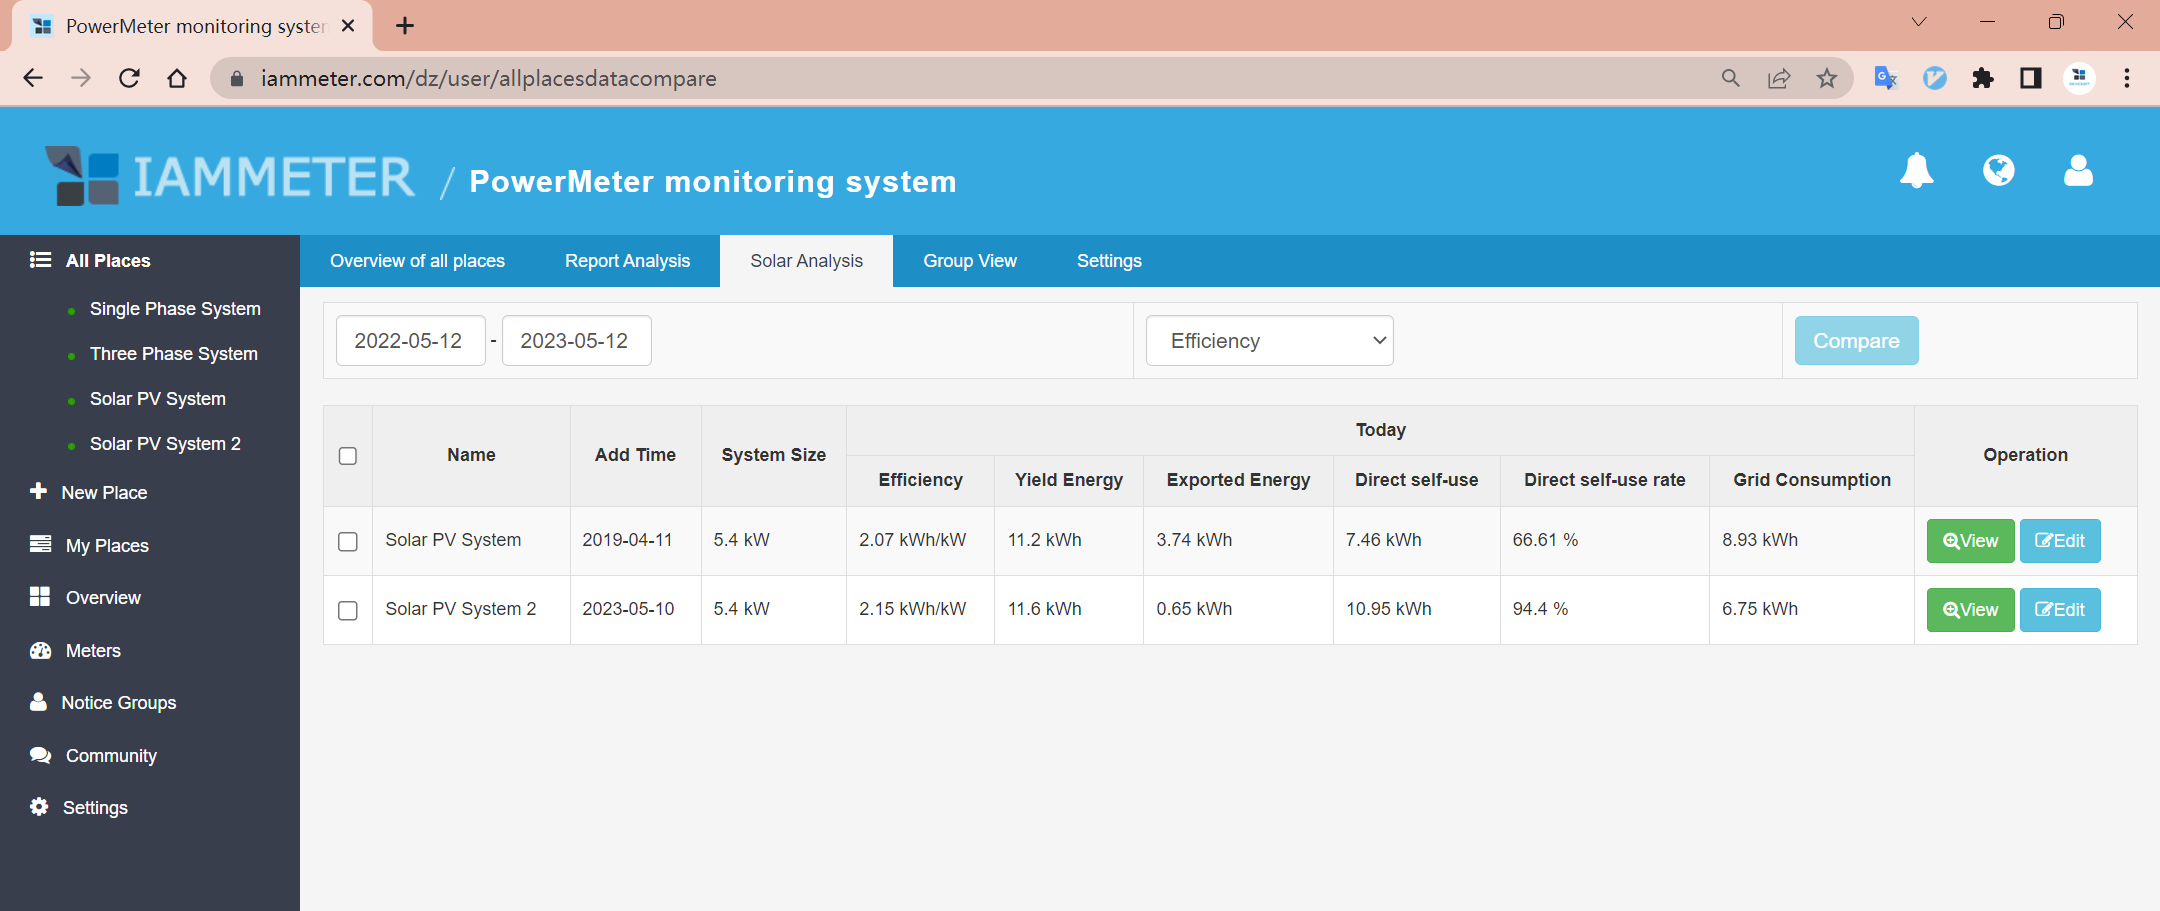
If you manage more than one solar PV site, IAMMETER can help compare site performance.
This is useful for:
Learn more:
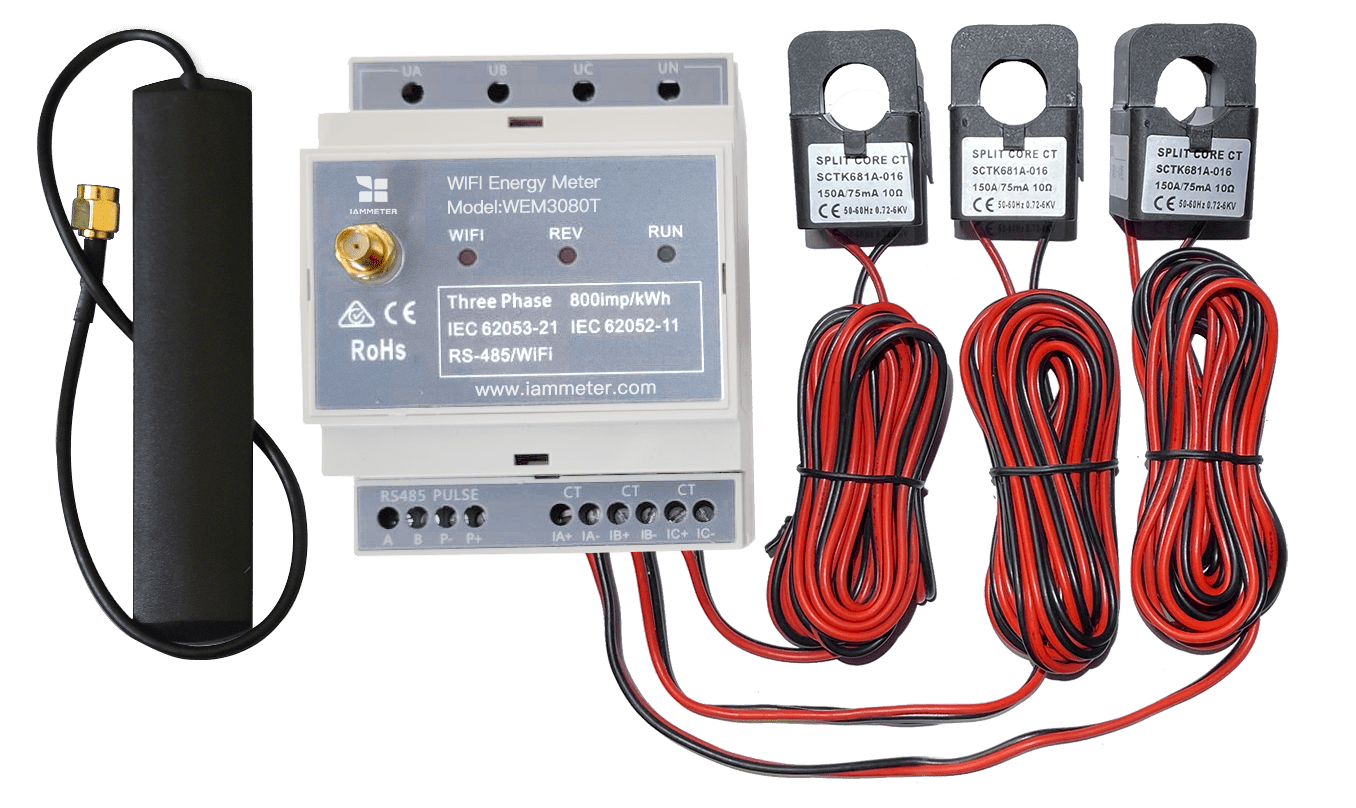
Three Phase Wi-Fi Energy Meter (WEM3080T)
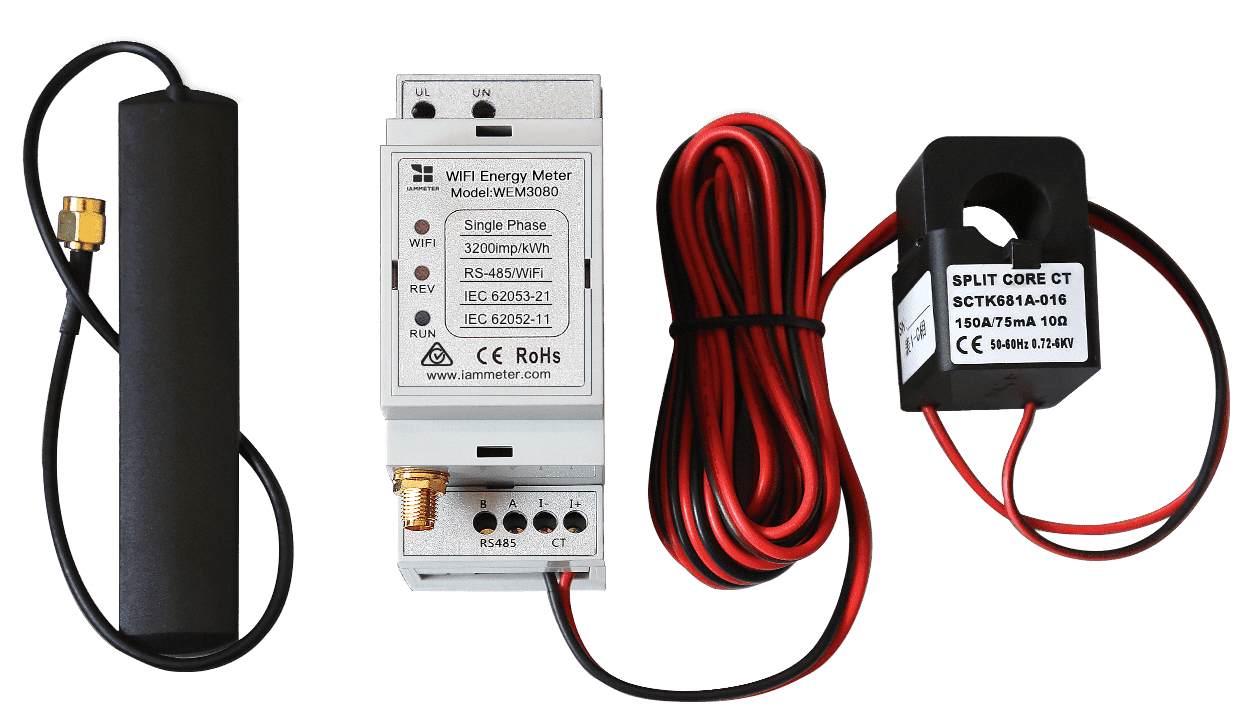
Single Phase Wi-Fi Energy Meter (WEM3080)
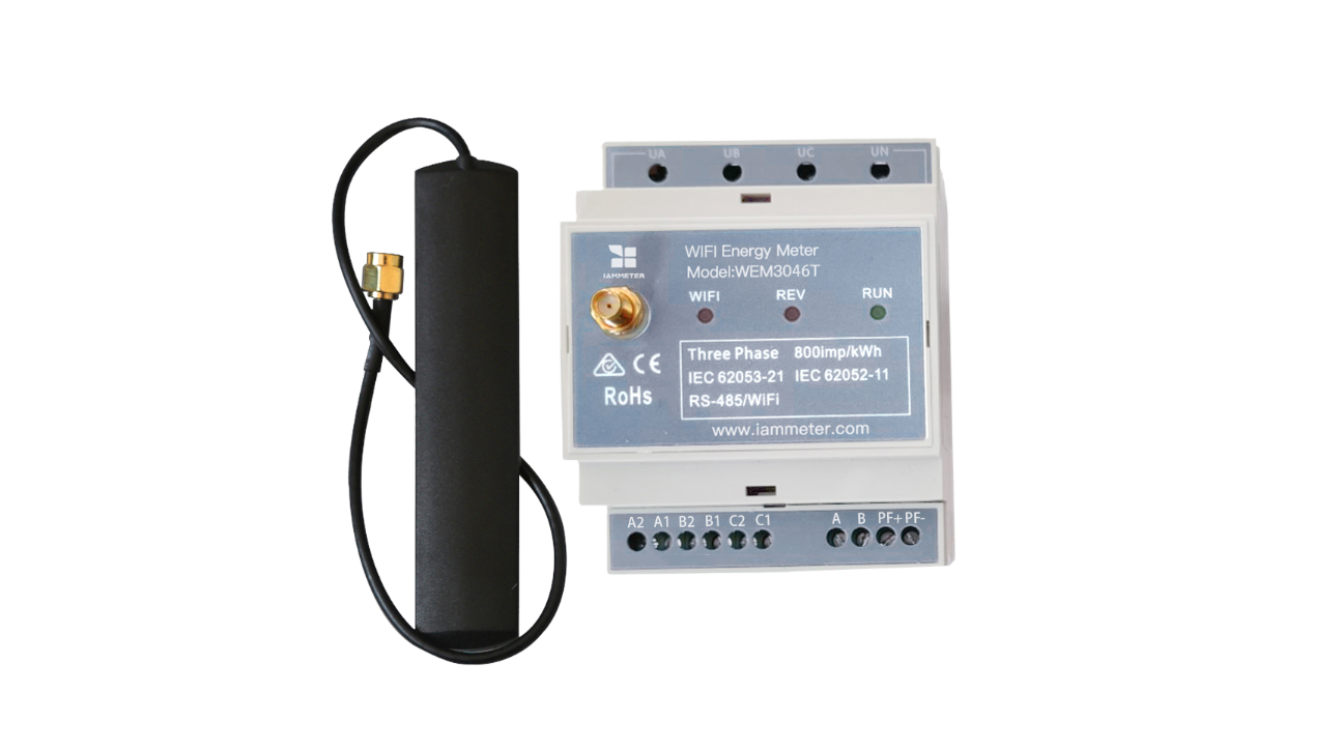
Three Phase Wi-Fi Energy Meter (WEM3046T)
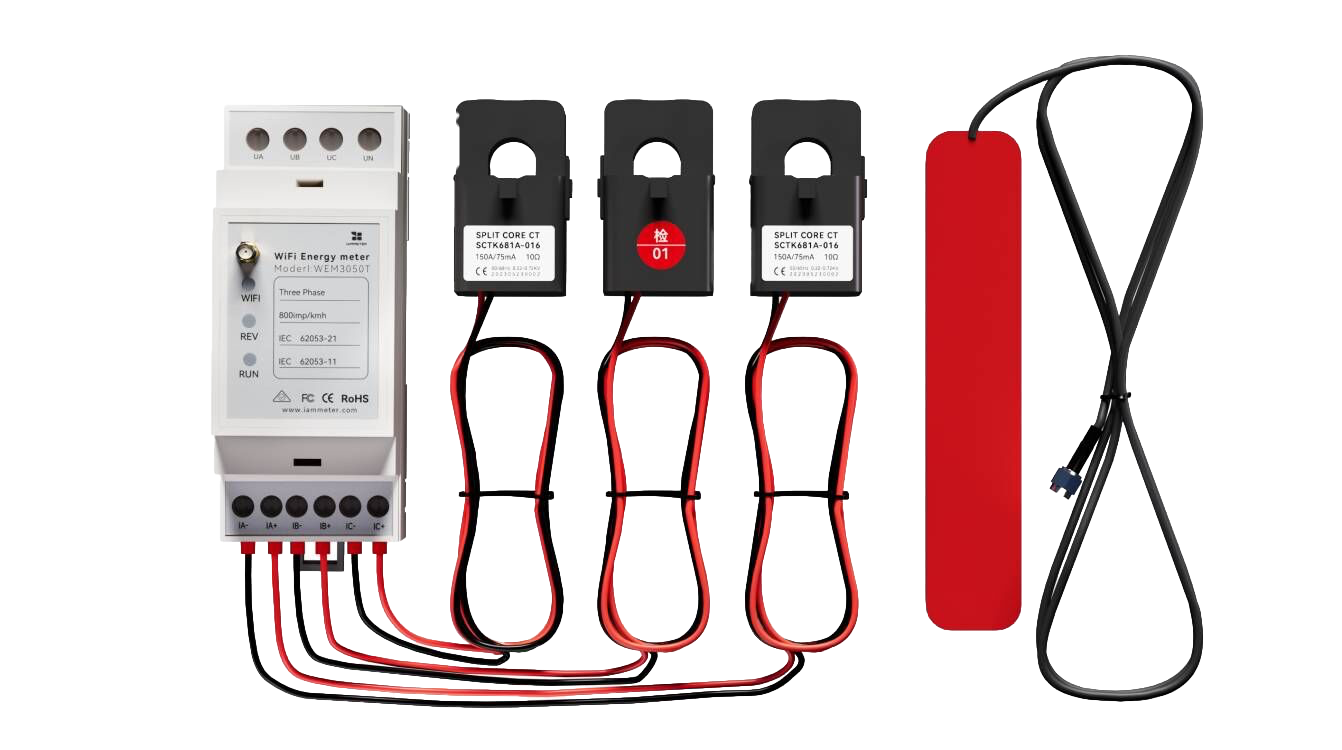
Three Phase Wi-Fi Energy Meter (WEM3050T)